For plant breeders and trial networks
Why does the same line rank differently from site to site?
Your models already fit G×E. What they cannot say is which part of the environment drives it. Most networks record soil chemistry and draw on weather and soil maps; almost none measure the soil's biology. We measure it, with chemistry, physics, satellite and climate data, and deliver all of it as covariates your model can test.

Thirty minutes with Julien Winkel and Dr Matthias Schaks. Bring a season of multi-environment trial data.
Covariates for every trial site, in the layout your model takes.
Per plot or per site, each variable with its unit and method, joined to your trial data by site, year and plot.
Site covariates · winter wheat network
Season 2026 · long format by site, year and plot
18trial sites
40variables per site
Illustrative| ID | Site | Soil | pH | Organic carbon | Bacterial diversity | Fusarium, % of fungi | Target environment |
|---|---|---|---|---|---|---|---|
| T-14 | Hochfeld | Silty clay | 7.0 | 1.6% | 6.4 | 9.8% | Under-represented |
| T-02 | Bördeacker | Loess | 7.1 | 1.4% | 6.8 | 2.1% | Covered |
| T-09 | Sandweg | Sand | 6.4 | 0.9% | 6.1 | 1.7% | Covered |
T-14Hochfeld
- Soil
- Silty clay
- pH
- 7.0
- Organic carbon
- 1.6%
- Bacterial diversity
- 6.4
- Fusarium, % of fungi
- 9.8%
- Target environment
- Under-represented
T-02Bördeacker
- Soil
- Loess
- pH
- 7.1
- Organic carbon
- 1.4%
- Bacterial diversity
- 6.8
- Fusarium, % of fungi
- 2.1%
- Target environment
- Covered
T-09Sandweg
- Soil
- Sand
- pH
- 6.4
- Organic carbon
- 0.9%
- Bacterial diversity
- 6.1
- Fusarium, % of fungi
- 1.7%
- Target environment
- Covered
Thirty minutes with Julien and Matthias, on your own trial network.
Your models fit G×E. They cannot say what drives it.
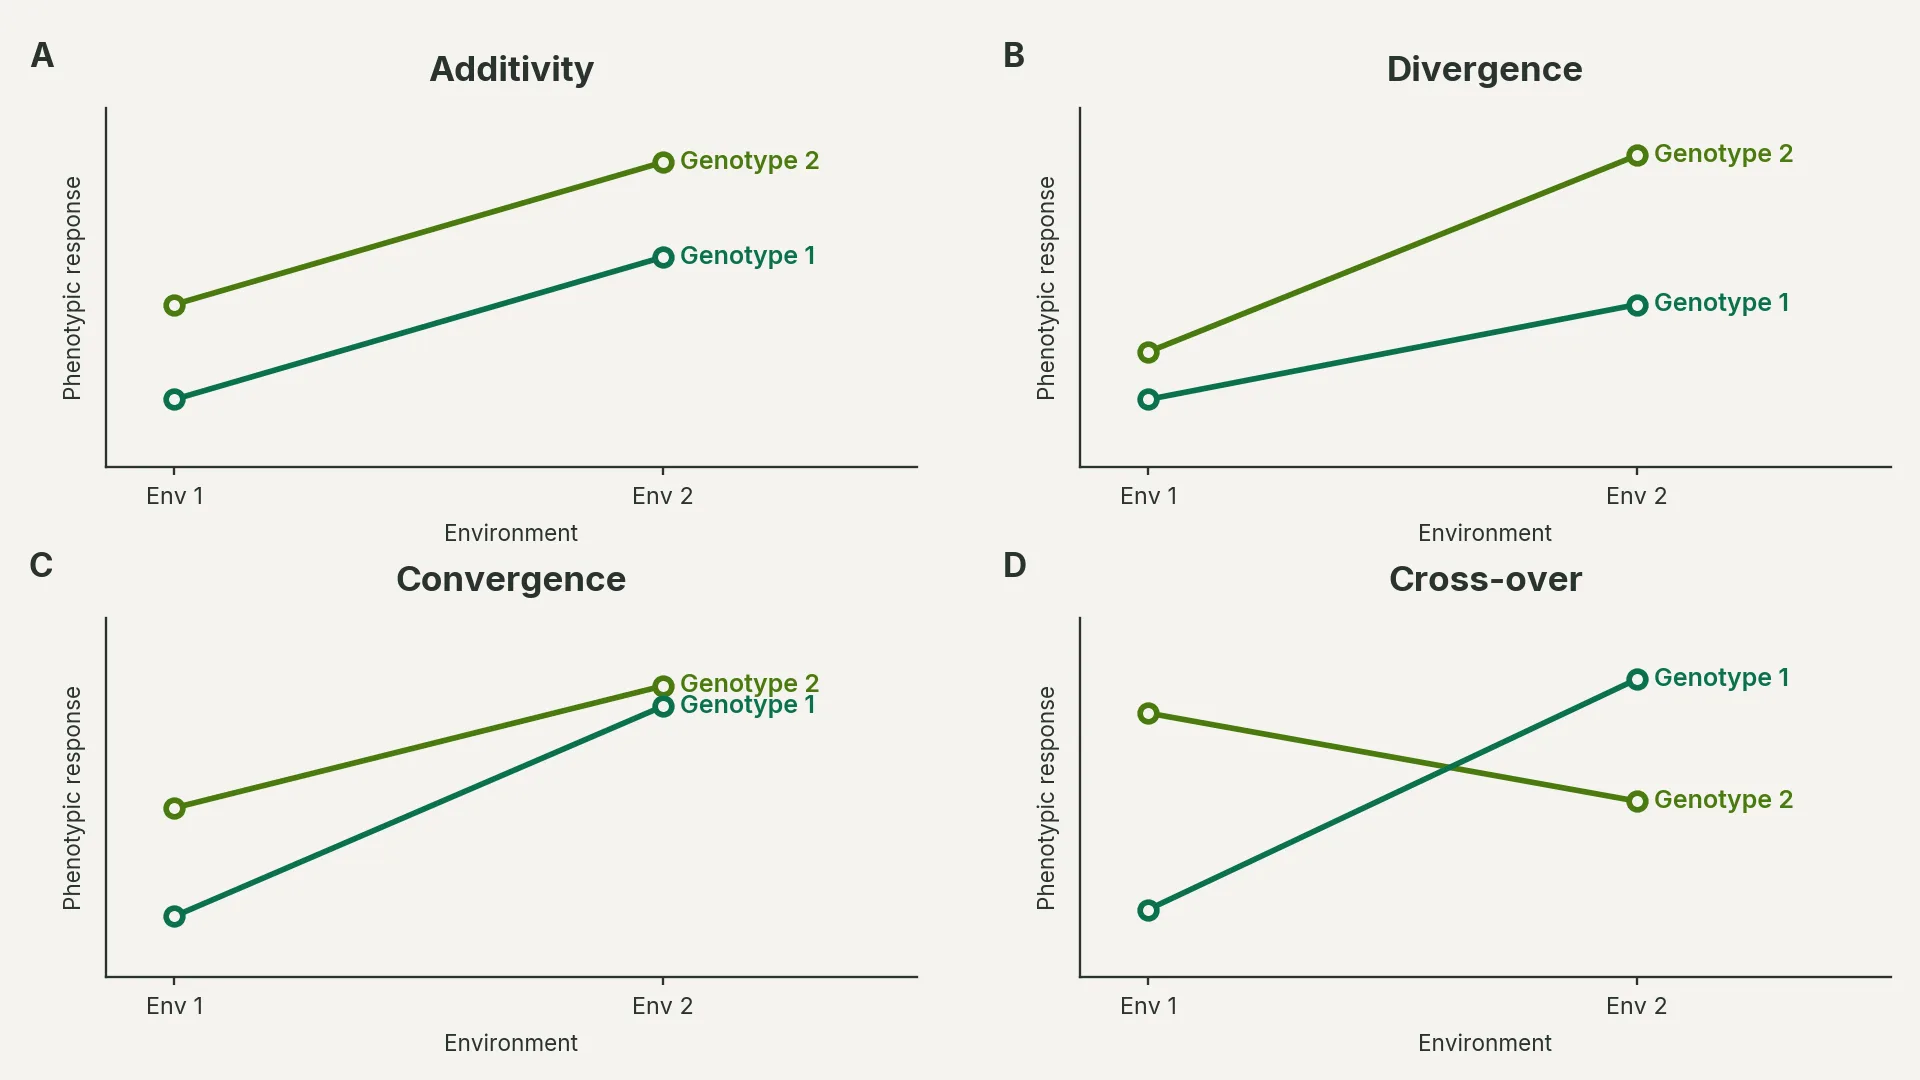
Site effects and G×E carry the soil whether or not you measured it. Without biological covariates you can see a candidate's rank change, but not which property of the site changed it, or whether a site represents your target population of environments.
Candidates that swap rank
A line leads at one site and trails at the next, in the same region and season.
Sites you cannot vouch for
If a trial site's soil is unlike your target population of environments, its ranking says less than it seems to.
Interaction with no cause attached
Seasons of trial data fit the interaction but cannot name the factor behind it, so the next selection repeats the guess.
What the soil can do to a ranking
Five winter wheat candidates at three sites in one region, in the same season.
Site A
Site B
Site C
| Site A | Site B | Site C | |
|---|---|---|---|
| Candidate 24 | 1 | 3 | 5 |
| Candidate 07 | 2 | 1 | 2 |
| Candidate 31 | 3 | 4 | 1 |
| Candidate 12 | 4 | 2 | 4 |
| Candidate 45 | 5 | 5 | 3 |
| Site A | Site B | Site C | |
|---|---|---|---|
| Candidate 24 | 1 | 3 | 5 |
| Candidate 07 | 2 | 1 | 2 |
| Candidate 31 | 3 | 4 | 1 |
| Candidate 12 | 4 | 2 | 4 |
| Candidate 45 | 5 | 5 | 3 |
Site ALoess
pH 7.1 · High water holding
Water held late into the season suited candidate 24's long grain fill.
Site BSand
pH 6.4 · Low water holding
The sand held little water by June, and candidate 24 fell back.
Site CSilty clay
pH 7.0 · High Fusarium share in the soil
A high load of Fusarium in the soil hit candidate 24 hardest. Only the soil's DNA showed it.
An illustrative example, not trial data.
From a soil sample to a column in your model.
We sample every trial site, sequence its bacteria and fungi, and measure its chemistry and physics, then add satellite and climate data for the season. Erdaphon-1 summarises each sample into variables: diversity, functional groups and the balance between major groups, alongside pH, texture and carbon. Matthias Schaks checks the set before it reaches you.
What comes out
Covariates for every site, measured the same way each season.
Ready to join to your trial data and test in your multi-environment or genomic model.
The evidence
Soil covariates help when the lines or the sites are already known.
In a soybean breeding study, soil type and its interaction with markers gave the best genomic prediction accuracy in three of four cross-validation schemes, about 25% above standard GBLUP at best. For new lines at new sites, GBLUP stayed best. That study used soil type and properties, not biology. No study has yet shown the same for soil biology; that is what the work with you tests.
Soil covariates against standard GBLUP, by cross-validation scheme.
- CV2Lines seen at some sites, predicted at the others: the largest gain, about 25% above GBLUP.
- CV1 and CV0New lines at known sites, and known lines at new sites: soil covariates still gave the best accuracy.
- CV00New lines at new sites: standard GBLUP stayed best.
Every trial site has its soil on record. Now we test what it explains.
The challenge
A breeding company saw the same lines swap rank between trial sites in one region, season after season.
What we did
Each trial site sampled on one protocol, its bacteria and fungi sequenced and its chemistry and physics measured, with satellite and climate data, joined to their trial analysis by site and year.
What they got
A soil and environmental profile of every trial site, delivered as covariates. The next step, under way, is testing how much of the rank change they explain.
Questions from breeding teams.
5 questionsHow does a microbial community become a covariate?
Each sample is summarised into variables: diversity indices, the share of functional groups such as saprotrophs, pathogens and mycorrhizal fungi, and the balance between major groups, alongside pH, texture, carbon and nutrients. Functional groups are assigned from reference databases, and we tell you which, and at what taxonomic level.
Does this replace our prediction model?
No. We add covariates to the model you already run. The model and its decisions stay yours.
How many sites and seasons do you need?
We start from the trial data you already have. The feasibility check settles how many sites and seasons to sample.
What about seed multiplication fields?
That is our work for seed producers. See the seed producers page.
What happens after the call?
A call. Thirty minutes on your question and the data you already have.
A feasibility check (go or no-go). A small fixed fee. Whether the answer is in your data, and what sampling it needs. It can end in no.
Build and test (go or no-go). We build it on your fields, agree in writing what counts as working, and test it on fields you held back.
Every season. It keeps running on the fields you name and improves as seasons add up. Your raw data stays yours.
Tell us about your trial network.
Your crops, how many trial sites you run, and how many seasons of data you have. Julien will reply as soon as he can, with times for a call, and Matthias joins it.
You leave the call knowing whether your trial data can carry soil covariates, and how many sites and seasons a test would need. If it can, the next step is a feasibility check for a small fixed fee, and it can end in no.

Julien WinkelChief Commercial Officer
Dr Matthias SchaksHead of Biomarker Development